Osama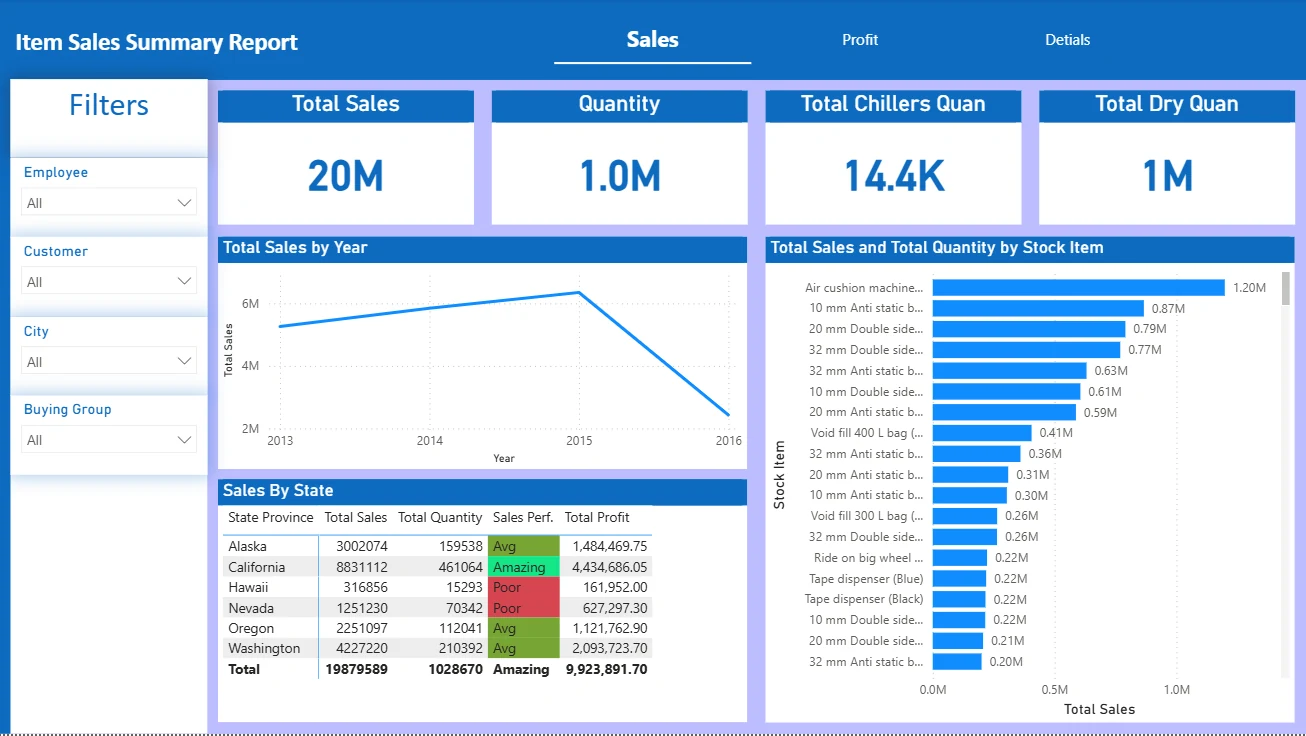
Power BI · Data Visualization
Power BI Dashboard
Project Brief
The objective was to design a highly interactive Power BI dashboard that consolidates raw data from multiple sources into a single, cohesive view, enabling stakeholders to monitor Key Performance Indicators (KPIs) in real-time.
Challenges
- •Integrating multiple datasets into a structured and logical data model.
- •Writing complex DAX measures to calculate custom metrics dynamically.
- •Designing a clean UI that doesn't overwhelm the user with too much data at once.
Solutions
- ✓Built a robust star-schema data model using Power Query to ensure smooth performance.
- ✓Utilized advanced DAX functions to implement time-intelligence and dynamic filtering.
- ✓Applied best practices in data visualization to create an intuitive layout with clear slicers and drill-through capabilities.
Impact
The dashboard eliminated the need for manual reporting, saving hours of work each week and providing decision-makers with a reliable tool to analyze trends instantly.
Technologies Used
- Power BI
- DAX
- Power Query
- Data Modeling